import matplotlib.pyplot as plt
import numpy as np
from sklearn.datasets import make_blobs
from sklearn.metrics import accuracy_score
from sklearn.tree import DecisionTreeClassifier

from frouros.callbacks.batch import PermutationTestDistanceBased
from frouros.detectors.data_drift import MMD
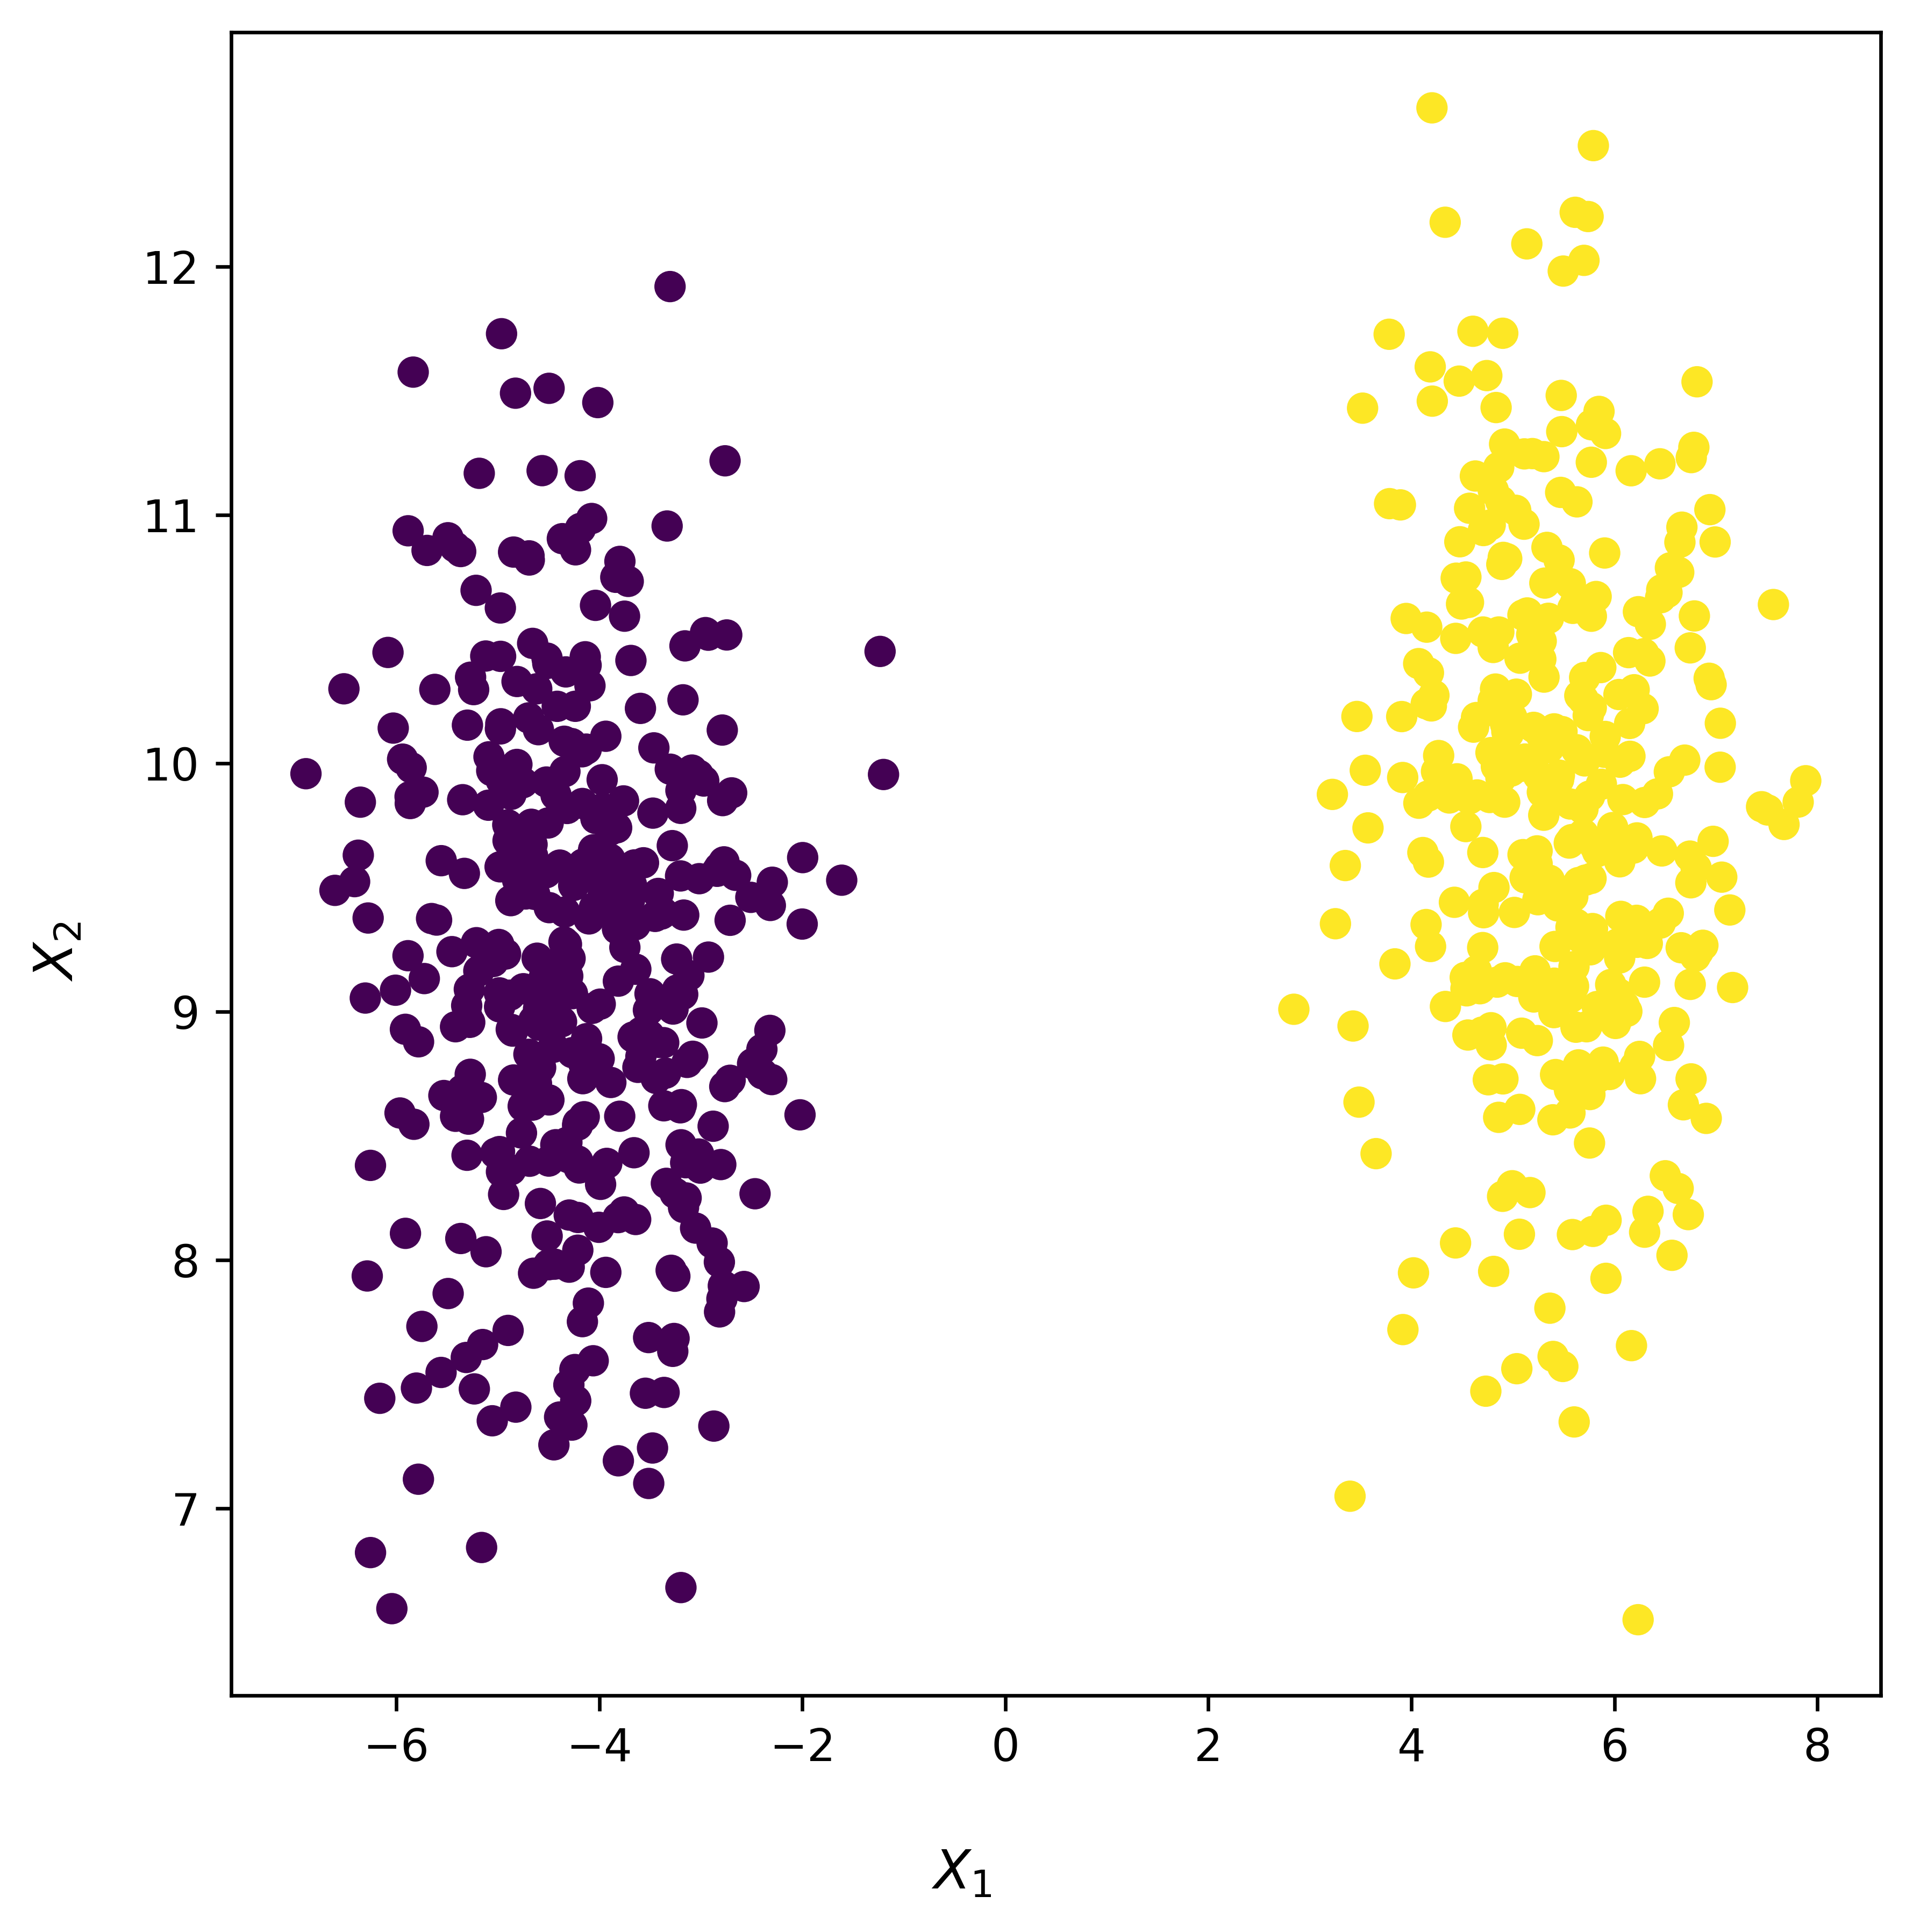
Multivariate detector#
The following example shows the use of MMD [1] multivariate detector for two different classes with two features each.
seed = 31
np.random.seed(seed=31)

X, y = make_blobs(
    n_samples=1000,
    n_features=2,
    centers=2,
    random_state=seed,
)
Data is split in 70% train and the remaining 30% for test.
idxs = np.arange(X.shape[0])
np.random.shuffle(idxs)
X, y = X[idxs], y[idxs]

idx_split = int(X.shape[0] * 0.7)
X_train, y_train, X_test, y_test = (
    X[:idx_split],
    y[:idx_split],
    X[idx_split:],
    y[idx_split:],
)
fig, ax = plt.subplots(figsize=(6, 6), dpi=600)
ax.scatter(X_train[:, 0], X_train[:, 1], marker="o", c=y_train)
fig.supxlabel("$X_{1}$")
fig.supylabel("$X_{2}$")
fig.tight_layout()
plt.show()
The significance level will be \(\alpha = 0.01\).
alpha = 0.01
Create and fit a MMD detector using the training dataset.
detector = MMD(
    callbacks=[
        PermutationTestDistanceBased(
            num_permutations=1000,
            random_state=31,
            num_jobs=-1,
            method="exact",
            name="permutation_test",
            verbose=True,
        ),
    ],
)
_ = detector.fit(X=X_train)
Fitting a decision tree with the training/reference dataset.
model = DecisionTreeClassifier(random_state=seed)
model.fit(X=X_train, y=y_train)
DecisionTreeClassifier(random_state=31)In a Jupyter environment, please rerun this cell to show the HTML representation or trust the notebook.
On GitHub, the HTML representation is unable to render, please try loading this page with nbviewer.org.
DecisionTreeClassifier(random_state=31)
In addition to obtaining the predictions for the test data by calling the predict method, the detector compares the reference data with test data to determine if drift is occurring.
y_pred = model.predict(X=X_test)
_, callback_logs = detector.compare(X=X_test)
p_value = callback_logs["permutation_test"]["p_value"]
print(f"p-value: {round(p_value, 4)}")
if p_value <= alpha:
    print("Data drift detected")
else:
    print("No data drift detected")
print(f"Accuracy: {round(accuracy_score(y_test, y_pred), 4)}")
p-value: 0.2707
No data drift detected
Accuracy: 1.0
  0%|          | 0/1000 [00:00<?, ?it/s]
 38%|███▊      | 375/1000 [00:00<00:01, 538.44it/s]
 62%|██████▎   | 625/1000 [00:01<00:00, 434.16it/s]
 88%|████████▊ | 875/1000 [00:02<00:00, 401.44it/s]
100%|██████████| 1000/1000 [00:02<00:00, 467.08it/s]
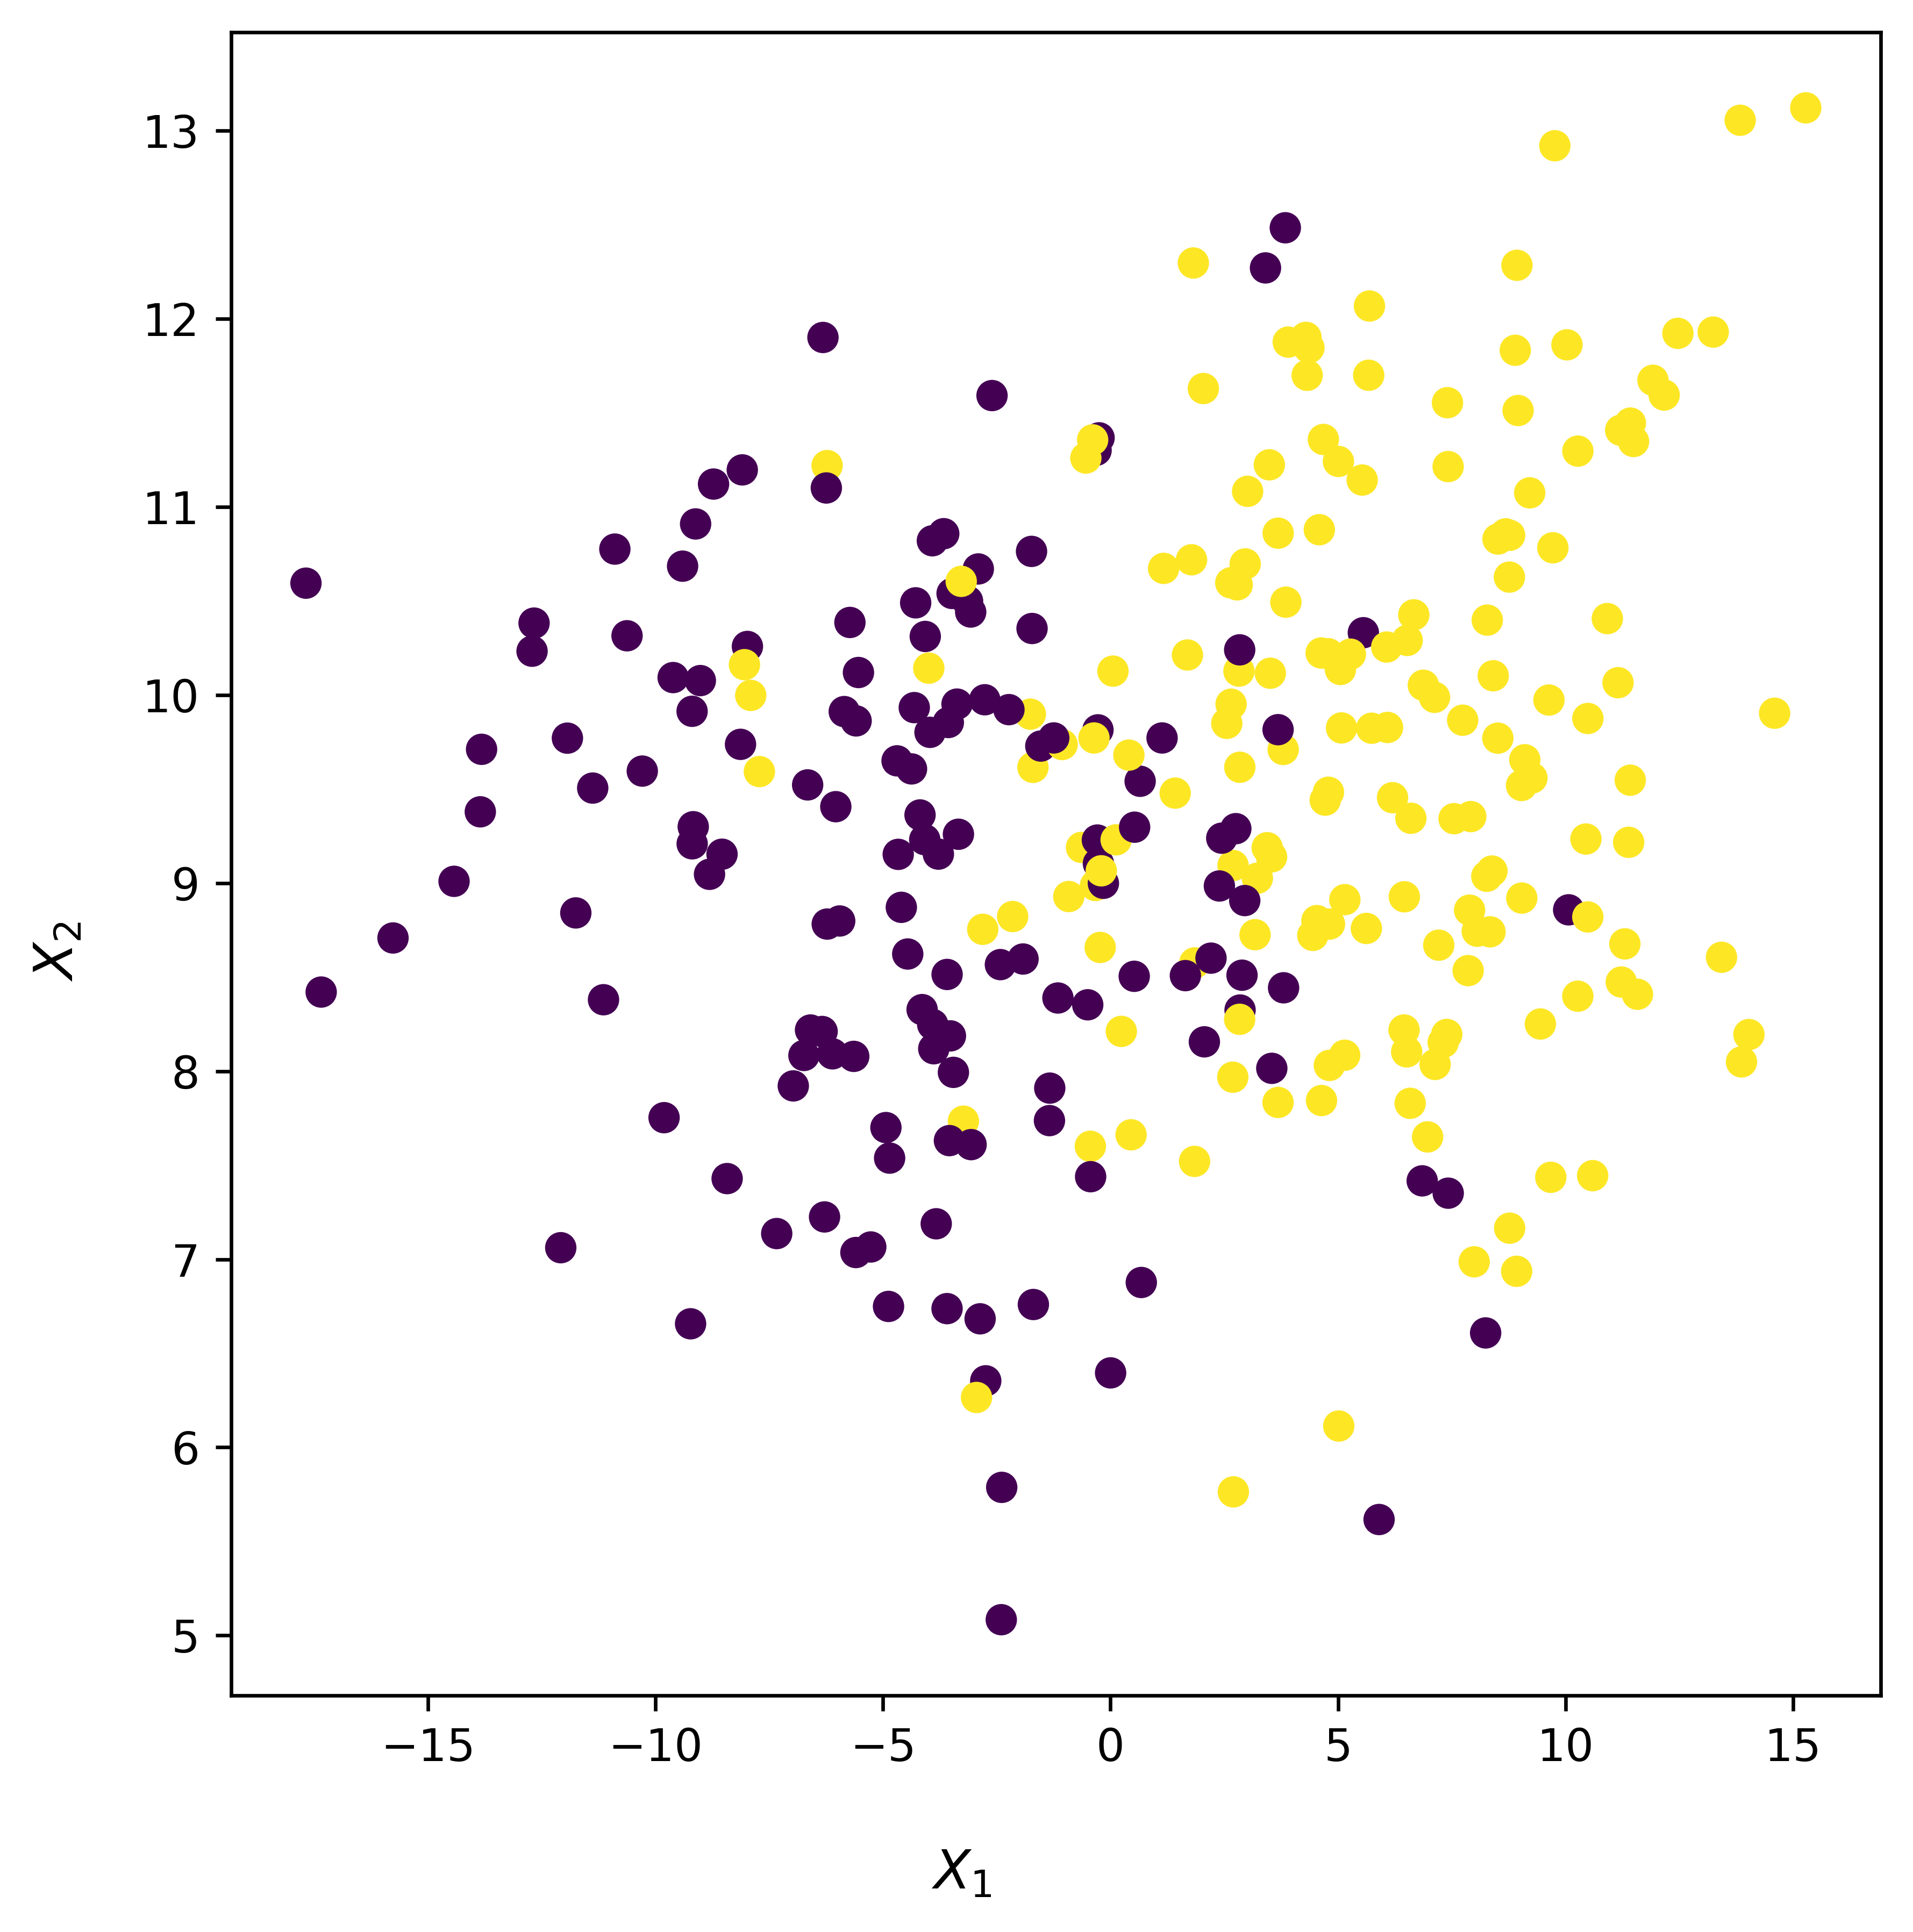
As the above results show, no data drift was detected. Therefore, we can simulate data drift by applying some noise to the test data, as shown below:
X_test_noise = X_test.copy()
X_test_noise += np.random.normal(  # Add noise to features
    loc=0,
    scale=X_test_noise.std(axis=0),
    size=X_test_noise.shape,
)
fig, ax = plt.subplots(figsize=(6, 6), dpi=600)
ax.scatter(X_test_noise[:, 0], X_test_noise[:, 1], marker="o", c=y_test)
fig.supxlabel("$X_{1}$")
fig.supylabel("$X_{2}$")
fig.tight_layout()
plt.show()
y_pred = model.predict(X=X_test_noise)
_, callback_logs = detector.compare(X=X_test_noise)
p_value = callback_logs["permutation_test"]["p_value"]
print(f"p-value: {round(p_value, 4)}")
if p_value <= alpha:
    print("Data drift detected")
else:
    print("No data drift detected")
print(f"Accuracy: {round(accuracy_score(y_test, y_pred), 4)}")
p-value: 0.001
Data drift detected
Accuracy: 0.8367
  0%|          | 0/1000 [00:00<?, ?it/s]
 38%|███▊      | 375/1000 [00:00<00:00, 1368.97it/s]
 62%|██████▎   | 625/1000 [00:00<00:00, 1139.87it/s]
 88%|████████▊ | 875/1000 [00:00<00:00, 918.06it/s]
100%|██████████| 1000/1000 [00:00<00:00, 1119.53it/s]
Data drift has been detected and the model’s performance has been affected by significantly lowering the accuracy value.
Arthur Gretton, Karsten M. Borgwardt, Malte J. Rasch, Bernhard Schölkopf, and Alexander Smola. A kernel two-sample test. Journal of Machine Learning Research, 13(25):723–773, 2012. URL: http://jmlr.org/papers/v13/gretton12a.html.